
Warp Cycling
for iOS
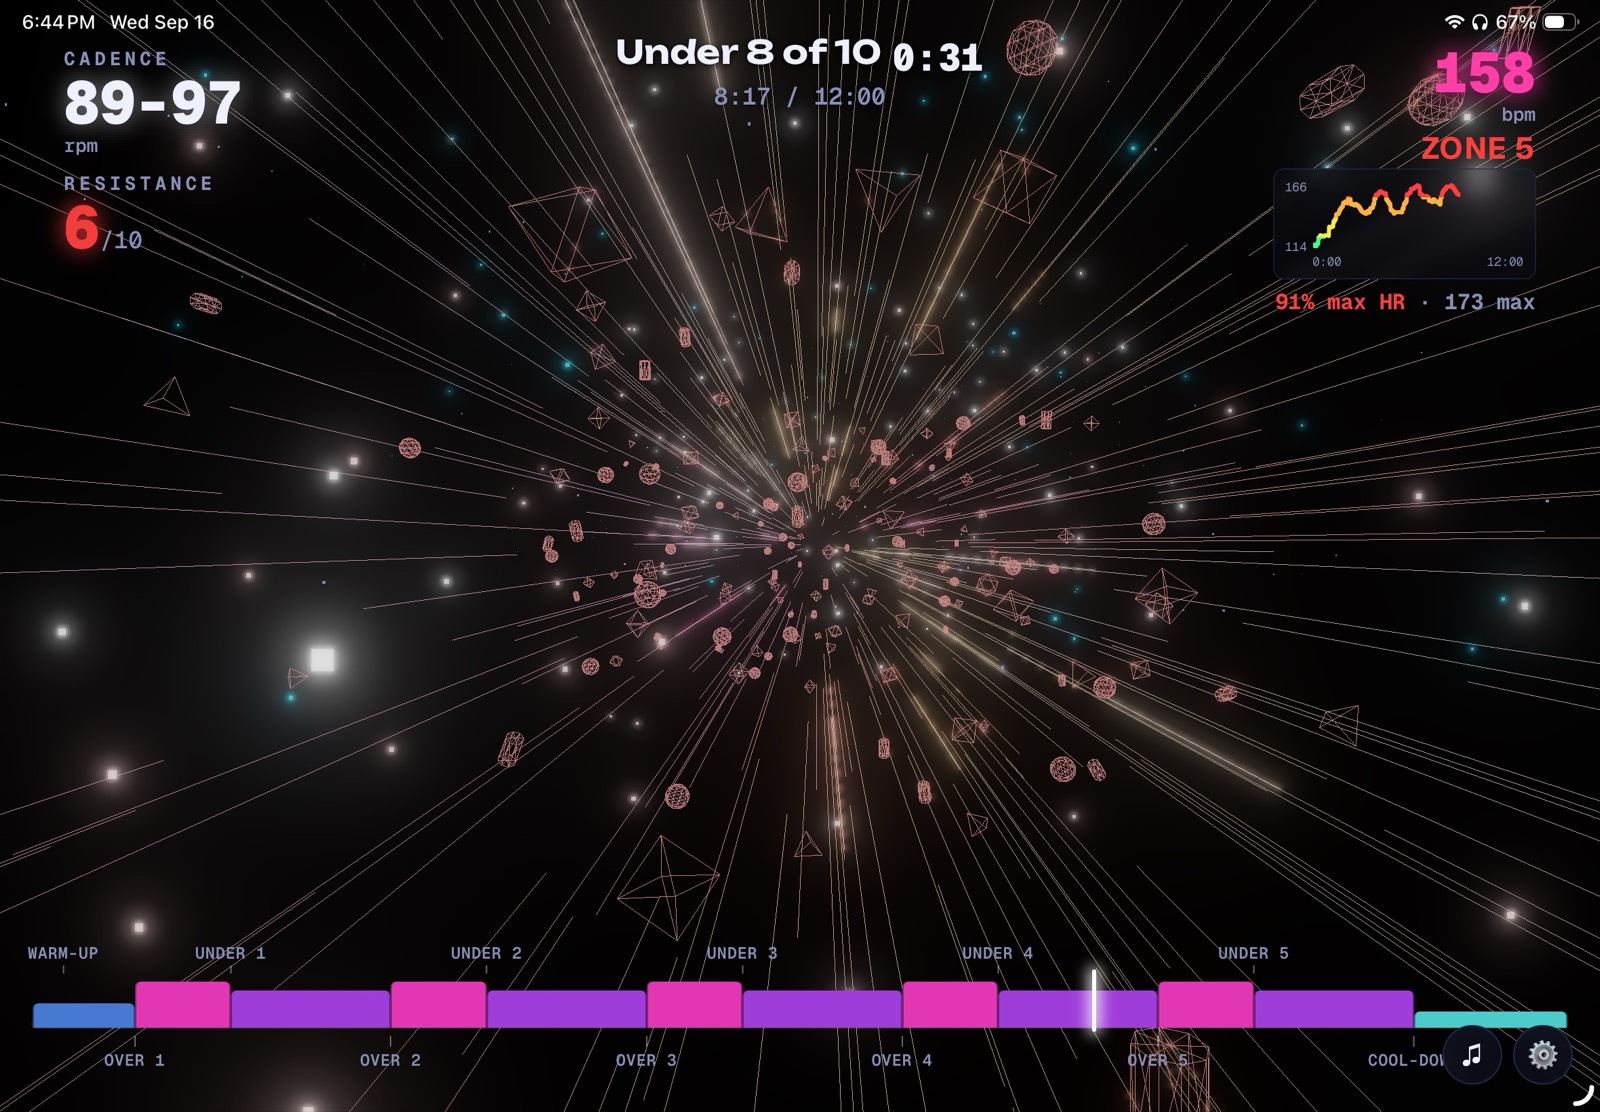
The world on screen reacts to your real heart rate, live — a native app with Apple Watch integration, mounted on your bike, iPad or iPhone.
Get an email the moment it's live in the App Store.
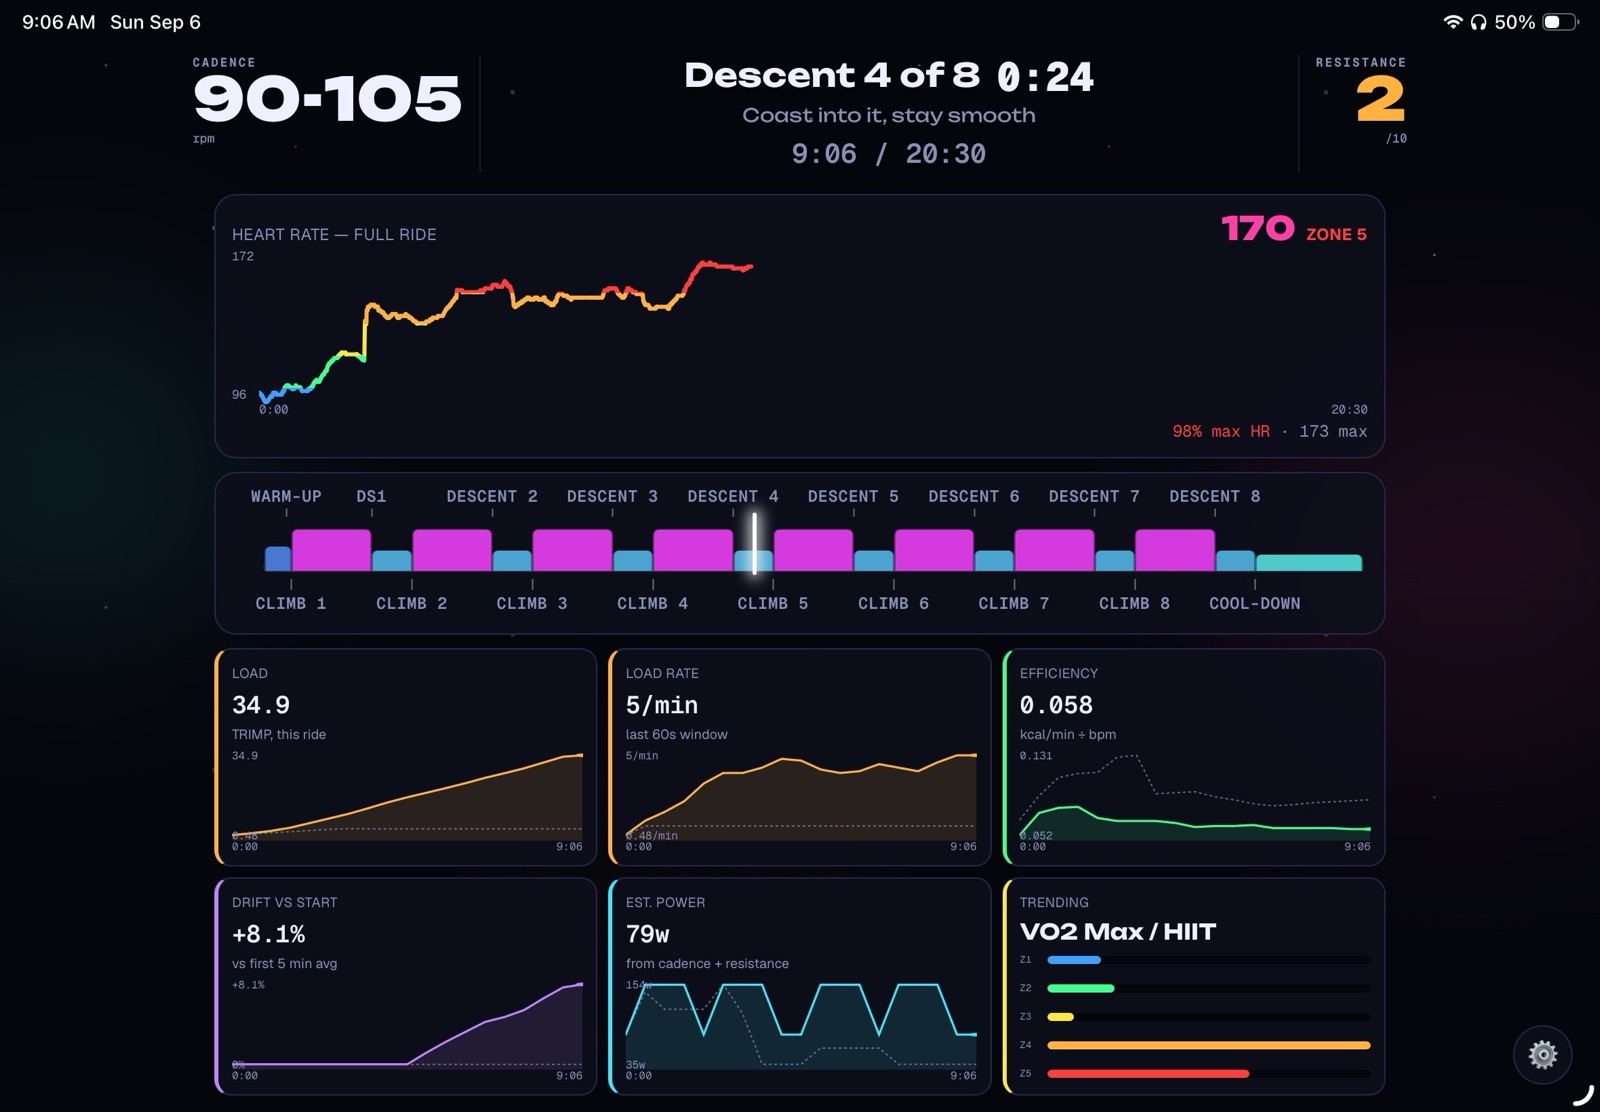
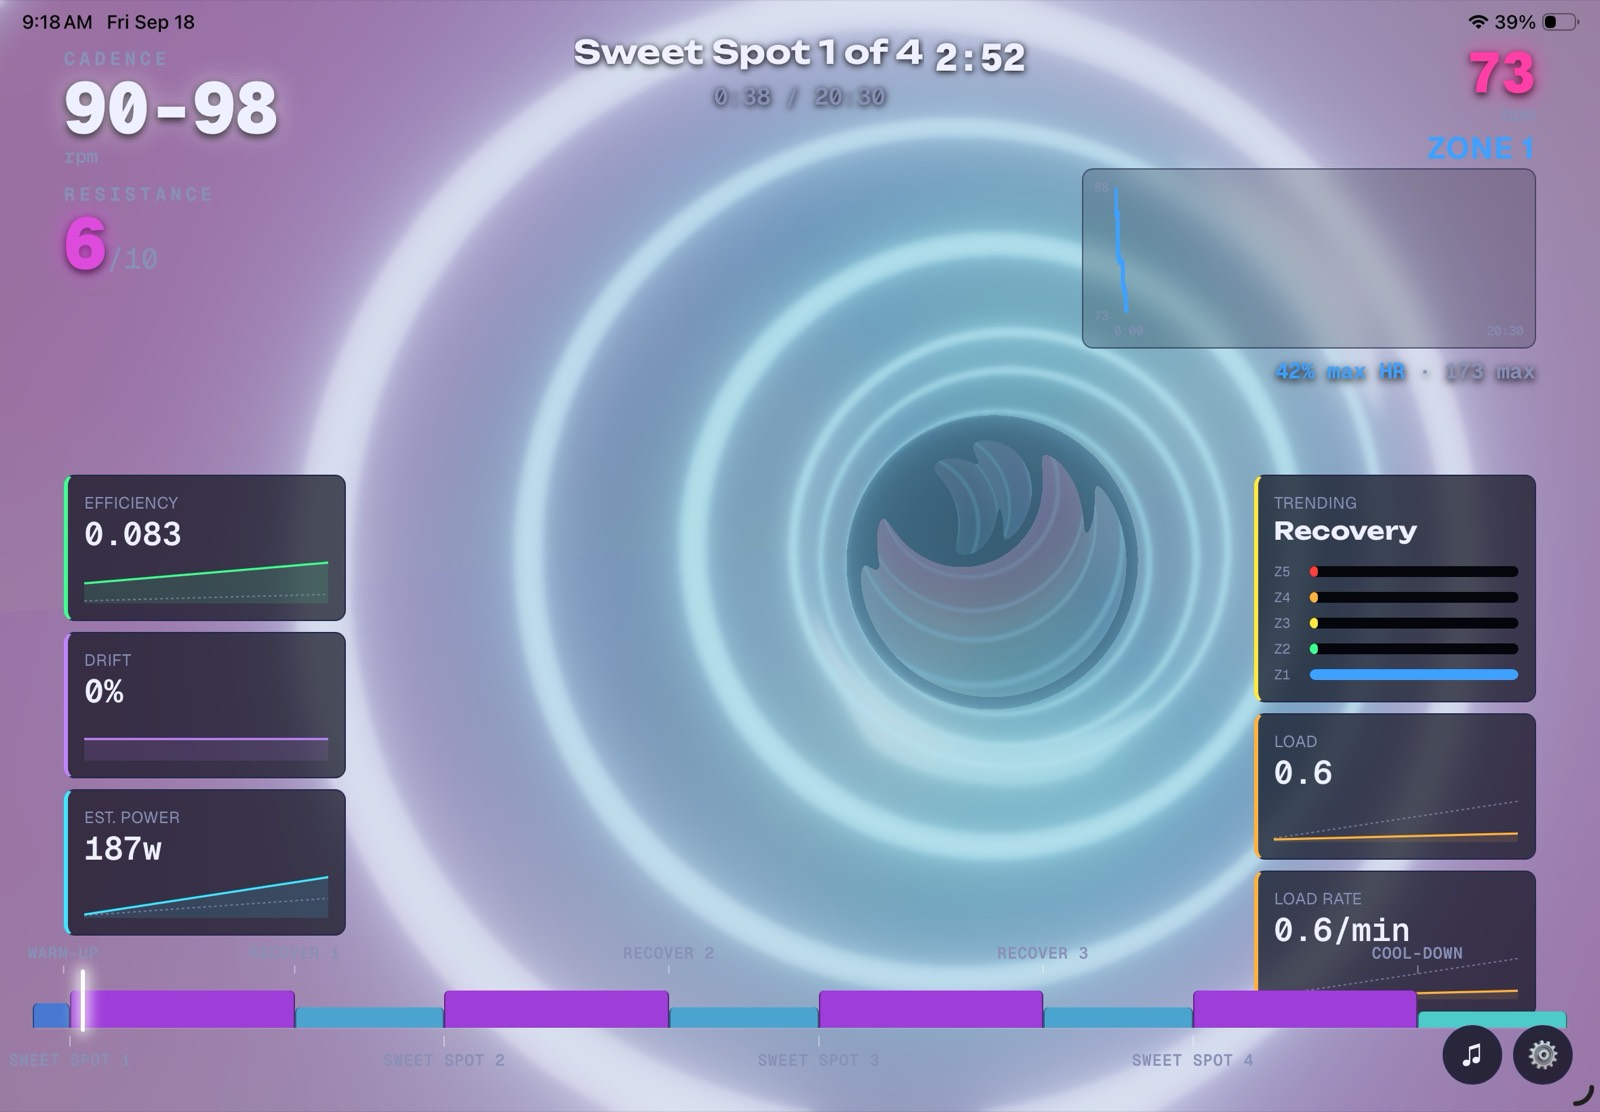
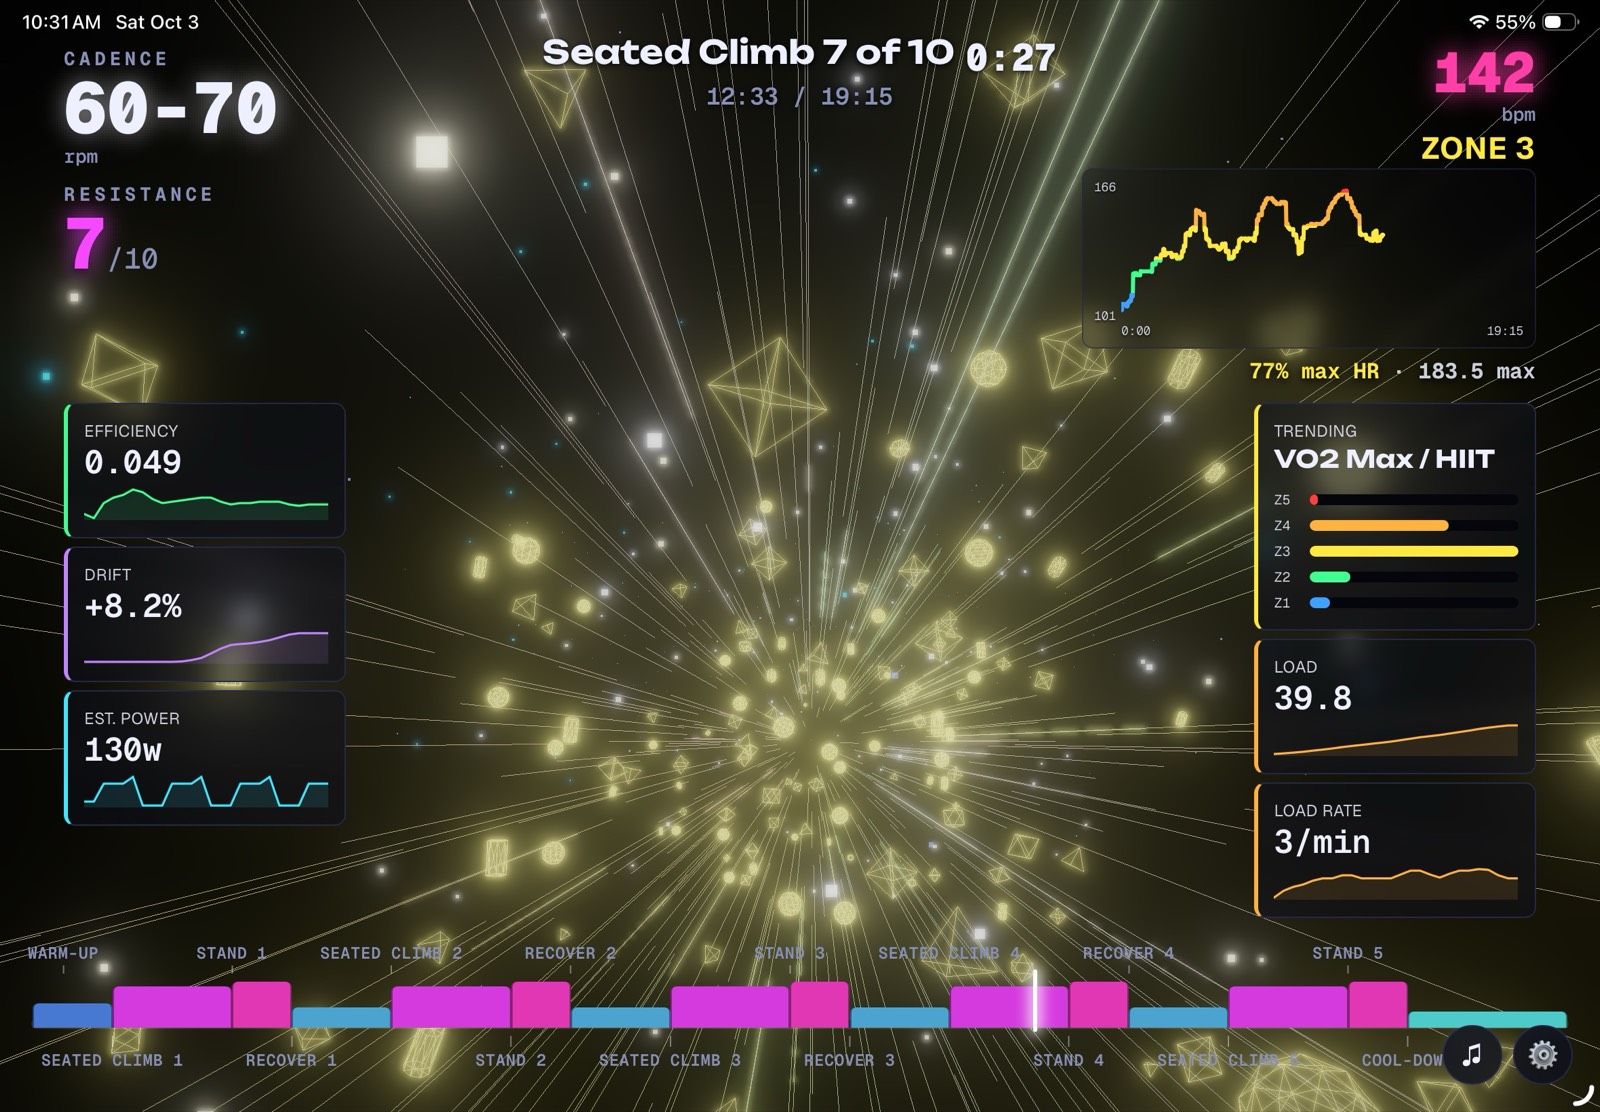
- –Professional-grade HR analytics, live — zone-accurate coloring, TRIMP training load, cardiac drift, efficiency factor
- –Apple Watch + universal Bluetooth heart rate support
- –The same full ride library, builder, and tracked history you already have on the web
Performance Lab
The leading real-time HR cycling analytics app
Free to try right now — pick Stats Ride as your style on Recovery Ride, no Pro required.
One account, every device — start a ride on your bike's iPad, check the numbers on your phone, review history on the web. Your rides sync automatically, no extra setup.
Real math, not a black box
Load
Zone-weighted training stress (a "TRIMP"), running total for the ride.
Load rate
How fast load is accumulating right now — a rolling window, not the cumulative total.
Efficiency
Output per heartbeat — a power-meter-free proxy for aerobic fitness.
Drift vs start
How far your current avg HR has crept above your first-5-minute baseline, at roughly the same effort.
Est. power
Estimated wattage from your cadence and resistance targets — no power meter required.
Trending
Every ride classified — Recovery, Endurance, Threshold, VO2 Max/HIIT — from its own zone-time mix.
Zone-accurate live HR
Your heart rate line is colored by exactly which zone it sits in at every point on the curve — not an approximation, geometrically exact.
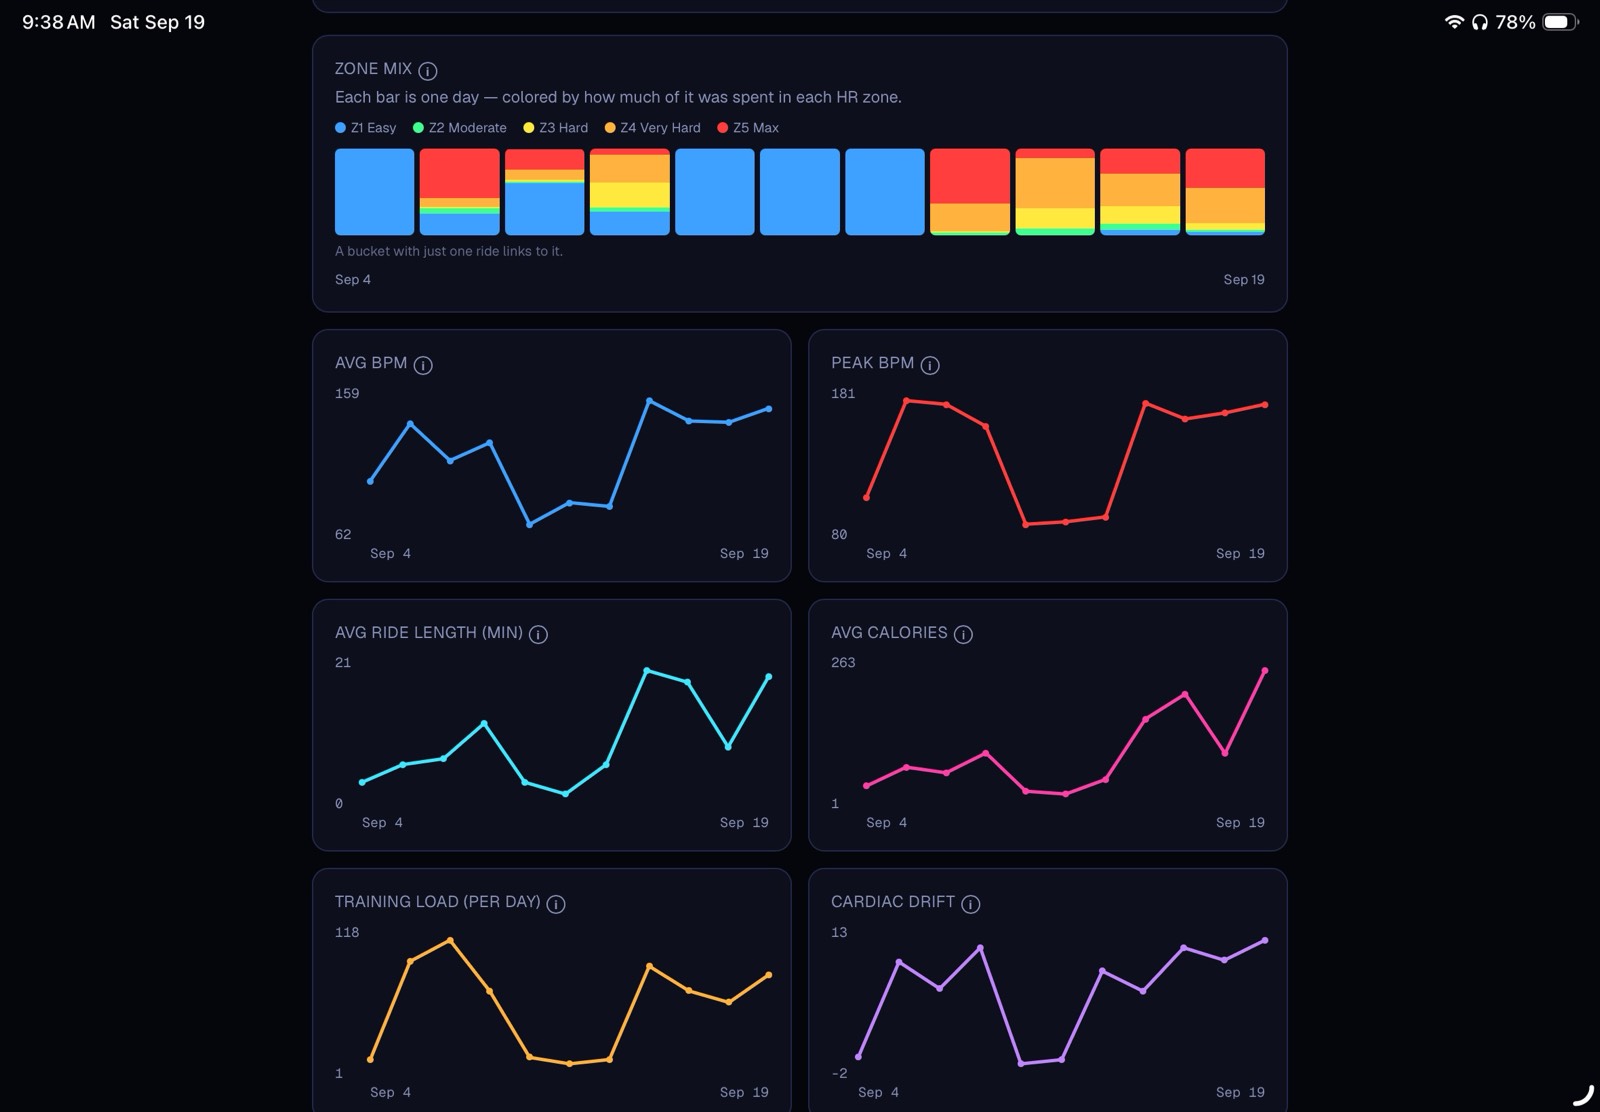
Training load, tracked
Every ride scored with a zone-weighted TRIMP and rolled up over time, so you can see overreaching before you feel it.
Cardiac drift & efficiency factor
The same metrics endurance coaches use to judge aerobic fitness — computed automatically from every ride, no extra hardware.
HR recovery rate
How fast your heart rate drops after a hard effort — one of the clearest signals your fitness is actually improving.
Cardio category coaching
Every ride classified — Recovery, Endurance, Threshold, VO2 Max/HIIT — tracked over time, with a nudge when you’ve skewed too hard one way.
Full history, your control
Every ride saved with its full HR curve and zone breakdown — filter, compare against your own averages, or delete anything you don’t want kept.